
Turn collected content into a working spreadsheet
A good content audit needs more than a list of links. You need to know which creator published a post, what it said, how it performed when you collected it, and why it belongs in your research. Trendlyst brings the collected data into a spreadsheet so you can spend your time interpreting it.
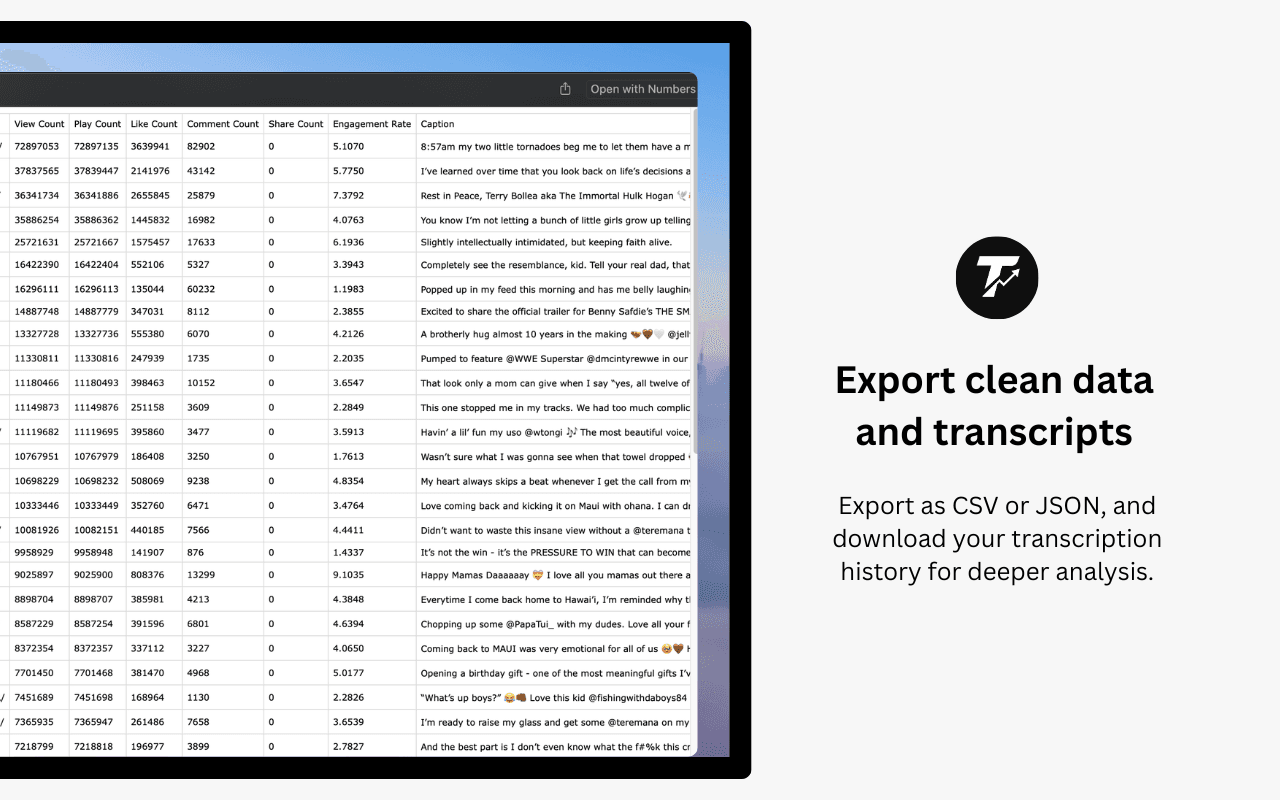
The Google Sheets export starts with results you collect in the extension on a supported Instagram page. It creates an online sheet using the same column structure as the CSV export. You can then add your own columns for campaign, topic, creative angle, or follow-up. Keep those observations beside the source information instead of maintaining a second document.
This is an on-demand export of your research session. It is useful when you want a deliberate snapshot: a shortlist for a client meeting, examples for a creative brief, or a record of the content you reviewed that day. The sheet does not become a live connection to Instagram.
How to export Instagram research to Google Sheets
1. Install Trendlyst in Chrome and open a supported Instagram profile or Reels page. Collect the content you want to study, then choose a ranking that suits your question. Views can help shortlist widely watched Reels; comments can help locate discussions worth reading.
2. Sign in to your Trendlyst account with active Pro access. Open the export controls and choose Google Sheets. If you have not connected Google, complete the connection flow in the window that opens. Return to the extension and export again after connecting.
3. Open the spreadsheet created by the export. Check the row count, source links, and relevant metric columns before sharing it. Add a collection date and a short description of the profile, content type, and ranking used so someone else can understand the sample.
4. Add your analysis beside the exported information. A useful review might label each post as a tutorial, demonstration, opinion, or story. Group the rows by topic and look for patterns that appear in more than one example. This makes the sheet a research document you can use to make decisions.
Choose Google Sheets, CSV, or JSON for the next step
Use Google Sheets when your next action is collaborative review in a browser. It removes the download-and-import step and gives you a document where you can add notes, filters, or charts. Sharing is controlled in Google Sheets, so check the document’s access settings before sending a link.
Use CSV when you want a portable file for Excel, Numbers, another spreadsheet application, or an offline archive. Core file exports are available in the free extension; direct Google Sheets creation requires Pro. If you only need an occasional file, start with CSV rather than choosing a plan for a workflow you will not use.
Use JSON when another application or a script needs structured records. The best format is the one your next tool can reliably read. Keep an original copy of an export before making extensive changes, particularly if several people will be editing the research.
Read the data with the right context
An exported metric describes the data available at collection time. It does not reveal a competitor’s private reach, unique viewers, conversions, or audience demographics. Missing values are not proof of zero activity. Inspect the original post when a number looks unexpected, and record uncertainty instead of filling it with an assumption.
Compare similar formats and publication windows. A Reel published months ago has had longer to accumulate views than one posted yesterday. A carousel and a video also invite different kinds of interaction. Split them into useful groups before calculating averages or naming a winner.
Add a reason for each shortlisted example. “Clear opening question,” “product shown in the first frame,” or “comments ask about the process” is more actionable than “high engagement.” The spreadsheet preserves the evidence; your notes explain what the team should learn from it.
A practical spreadsheet for a creative review
Start with a narrow question such as which product demonstrations make their benefit clear early. Collect a comparable set of posts from a few relevant profiles. Keep the original source URL, caption, date, and available performance data, then add columns for the opening, demonstration style, and call to action.
Review the posts themselves before assigning labels. Captions alone may not describe what happens in the video. Mark the examples that fit the brief, write down what makes each useful, and include at least one contrasting example so the discussion does not rely on a single successful post.
When the review is complete, share a focused shortlist rather than an unexplained data dump. Include the research question, collection date, and limitations at the top of the sheet. This gives the next person enough context to challenge the conclusion or follow the source without repeating the whole collection process.
Connect the next step
Explore all Instagram research features to build your workflow. Continue with Instagram CSV exports. Or explore Custom Instagram Scoring Formulas. Or explore An Instagram Content Library for Your Ideas. Or explore Trendlyst vs WhatTheFeed.
Common questions
Does the sheet refresh automatically?
No. This workflow creates a spreadsheet from the data you export. Export again when you need a new snapshot; it is not scheduled synchronization.
Is Google Sheets export free?
Direct Google Sheets export requires Trendlyst Pro and a Google connection. You can start with free CSV, JSON, and spreadsheet-compatible file exports.
Can I export an entire account?
The export uses the results collected in your session. The Google Sheets option has a size limit shown by the extension; use CSV or JSON for larger exports. It does not guarantee a complete account history.